
In Part 2 of the Salesforce Reporting series, we learned how to create a report with a Tabular Format. Today, we will be creating another simple and easy-to-learn Salesforce Report Format – a Summary Report.
What is a Summary Report?
Summary Reports are reports that provide a little bit more organization and formatting than their report sibling, the Tabular Report. As discussed in the previous reporting series post, Tabular reports are basically spreadsheets of data. However, Summary Reports take the Tabular spreadsheet-type report one step further by summarizing specific fields and values to make the data easier to read and analyze.
Considerations for Summary Reports
Although Summary Reports are simple, they do not have as many restrictions as the Tabular Report. Summary reports are supported in Dashboards** and can utilize Report Charts**. Additionally, Summary report formats can also include Bucket Fields** and Formulas, however, Cross-Object Formulas are not supported in the Summary Reports.
**Bucket Fields, Report Charts, and Dashboards will be covered in later posts. Check out the bottom of this page for related posts!
Another consideration of Summary Reports is that there are two ways to Summarize a Report:
- By Grouping Rows in the report outline
- By using the Summarize option on a numeric column
We will cover both Summary methods below.
How to Create a Summary Report in Salesforce
In the previous report post, we wanted to know, “How many Opportunities in Salesforce that have a documented Lead Source exist?”
Now, let’s dig a little deeper and determine, “How many Opportunities exist for each of the Lead Sources?”
Note: To follow along with the steps below, use or create a Playground from Salesforce Trailhead or a Developer Edition org.
(If you are creating your Summary report by starting from the Tabular report from the prior reporting series part 2 post, skip to step 10.)
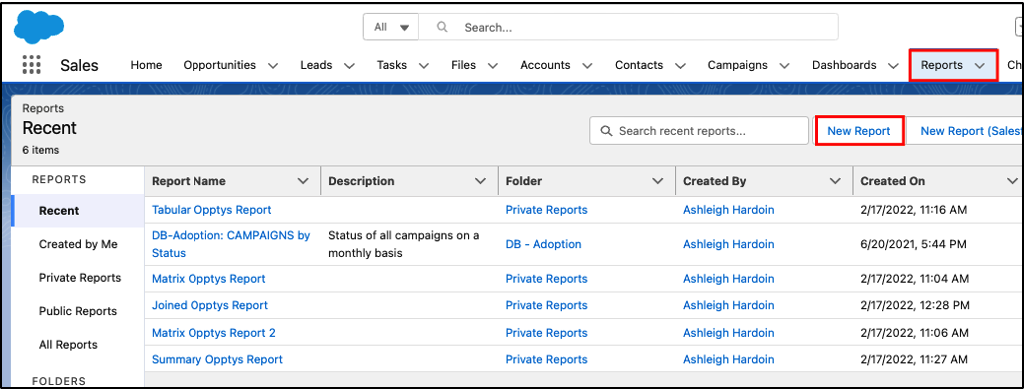
- In Salesforce, navigate to the Reports tab, and click New Report.
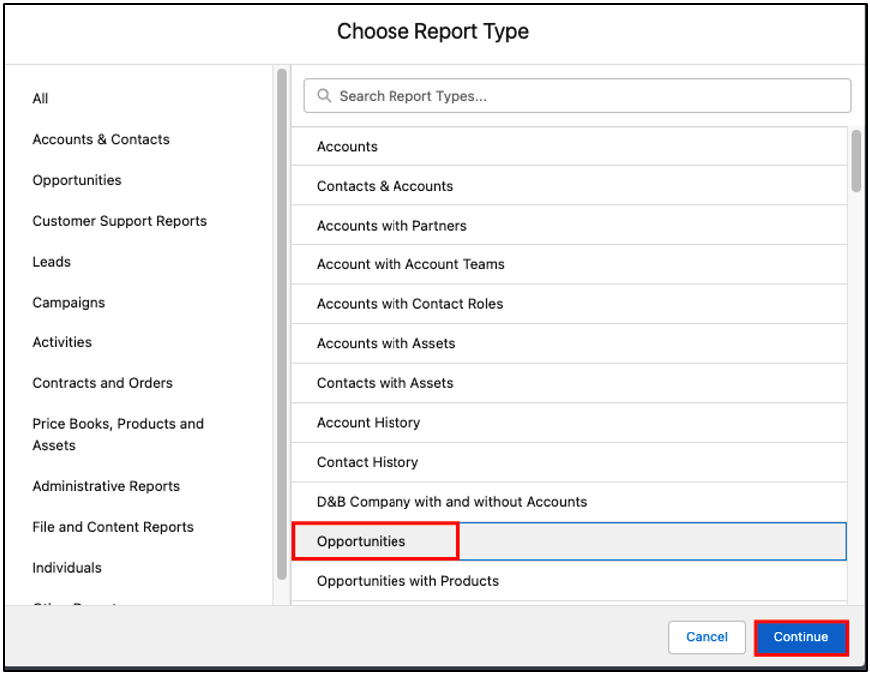
- Select the Opportunities Report Type, and click Continue.
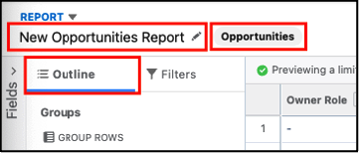
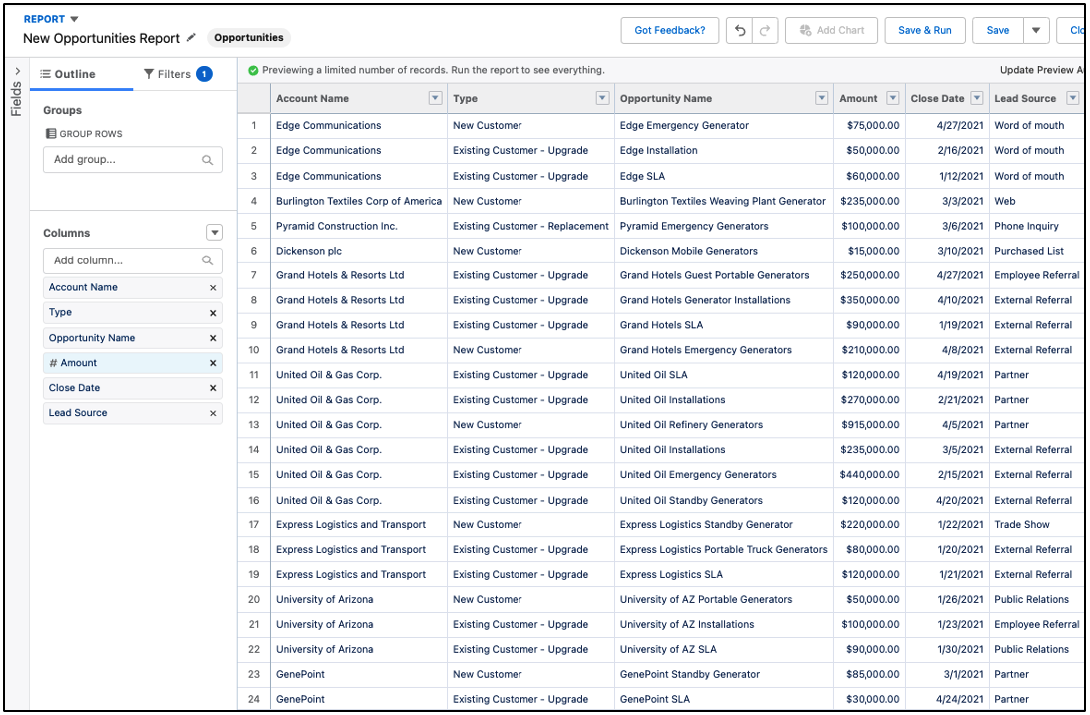
- Notice that when the report generates, the Report Type and Report Name display above the Outline. The actions are located at the top, right.
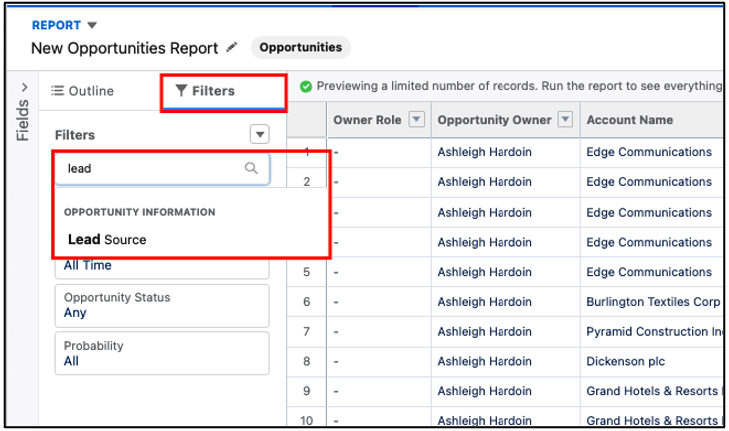
- Since we want to see all Opportunities with a documented Lead Source, update the Close Date to All Time and add Lead Source as a Report Filter. To add the Lead Source as a Report Filter, click on the Report Filters tab, search for the Lead Source field in the search bar, and select it.
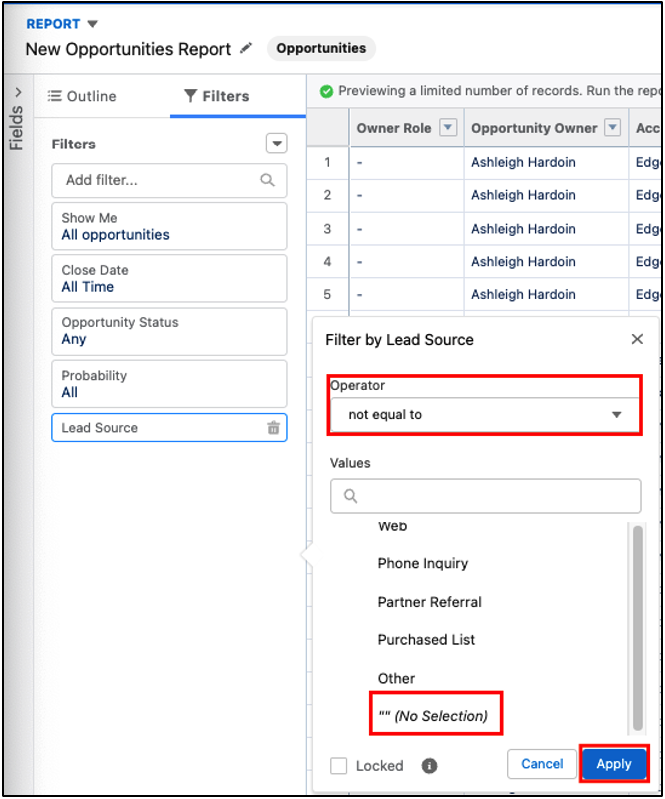
- Filter the Lead Source field so that undocumented values (aka blank values) don’t show by changing the Operator to not equal to and selecting the blank, “” (No Selection) value from the list. Save this filter by clicking Apply.
- Next, navigate back to the Report Outline to select the data that should be included in our report.
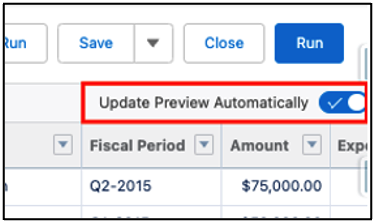
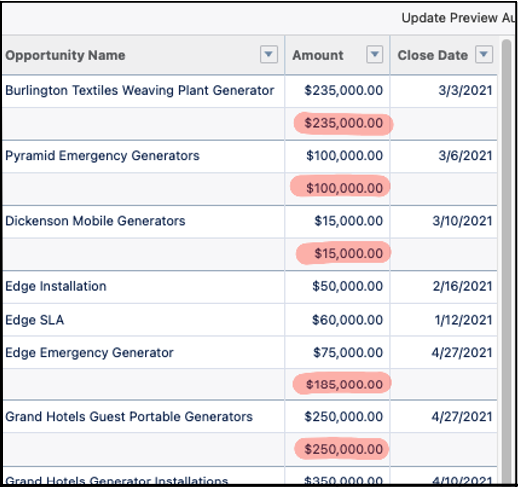
- When the Update Preview Automatically toggle is toggled on, the Columns in the Report Outline match the columns in the report preview. The report preview also updates in real-time when columns are added or removed.
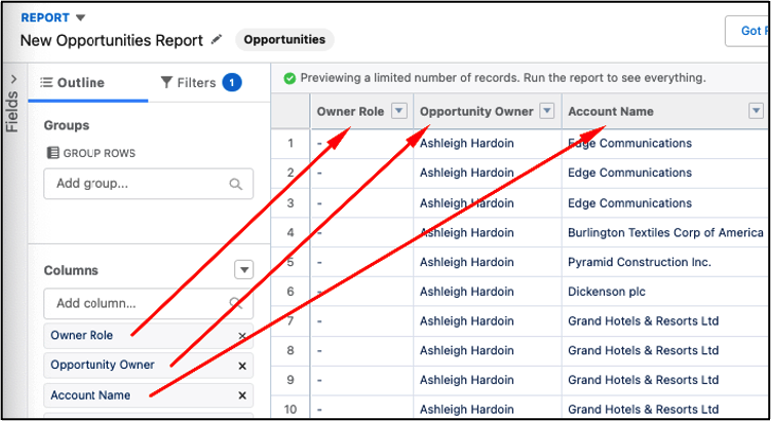
- Drag and drop Columns in the Outline to reorder them, and click the X on the Columns that we want to remove from the report. Update the Columns on this report to the following order and remove the rest: Account Name, Type, Opportunity Name, Amount, Close Date, Lead Source.
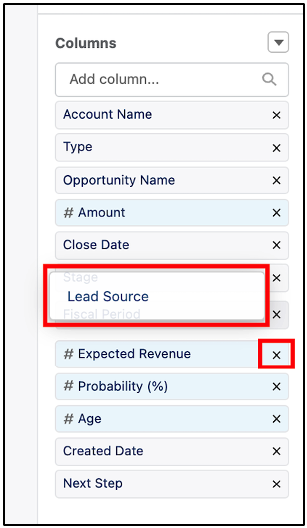
- In the report preview, we can see that there doesn’t appear to be any order or sorting to the records in the report. We will fix this by summarizing data on the Salesforce report, which will change the report format to a Summary Report.
- As stated above, there are two ways to Summarize a Report:
- By Grouping Rows in the report outline
- By using the Summarize option on a numeric column
Grouping Rows in the Report Outline
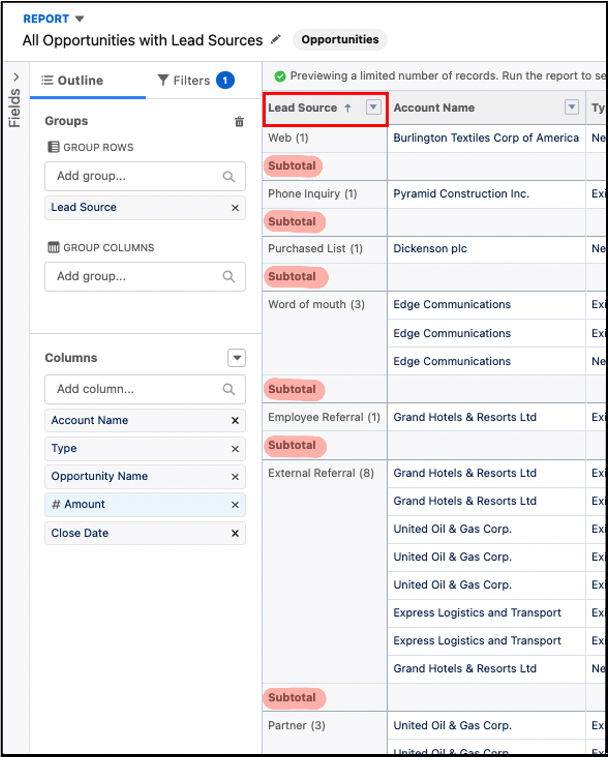
To determine what data we should use for grouping, we’ll need to refer back to our initial question: “How many Opportunities exist for each of the Lead Sources?”
By taking a second look at the report, we can see that if we group information by the Lead Source, we’d be able to view the report data in format that’s more likely to answer our question.
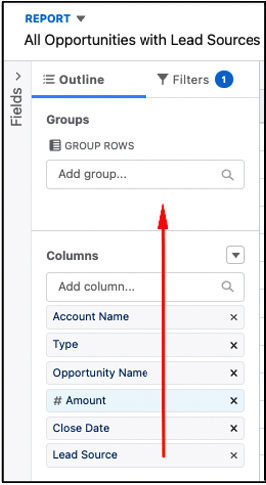
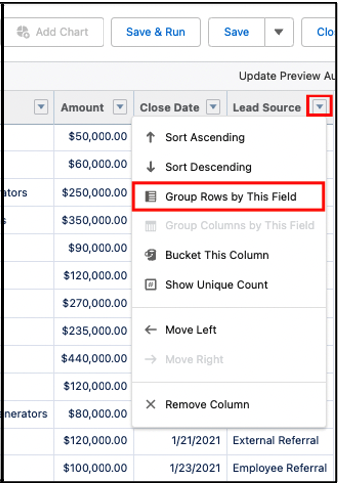
- Summarize the Lead Source by either: 1) click and drag the Lead Source column in the report Outline into the Group Rows section, or 2) click the dropdown arrow in the Lead Source column and click Group Rows by This Field.
- In the farthest column to the left, the Lead Source column values are now grouped by rows. This report format gives us the ability to answer our initial question by viewing the Subtotals for each Lead Source value.
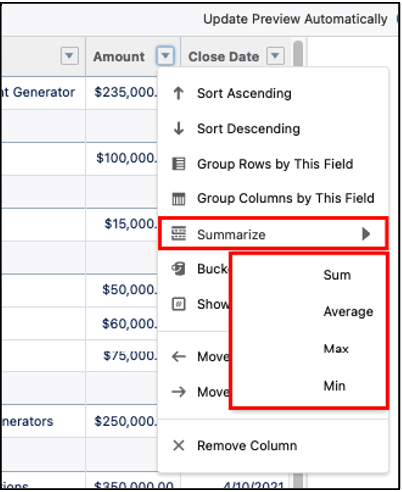
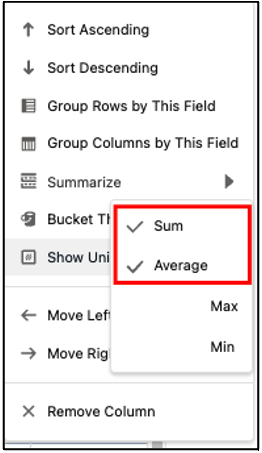
Using the Summarize Option on a Numeric Column
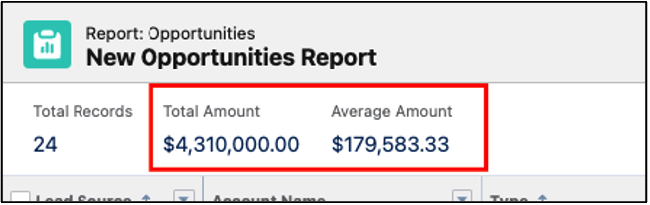
Another way to summarize reports in Salesforce is by using the Summarize option for numeric columns. In our report example, the Amount field is a numeric column, so we will summarize by this field. Click the down arrow in the Amount column header, then mouse over the Summarize option. Four options are available to summarize this column: 1) Sum, 2) Average, 3) Max, and 4) Min.
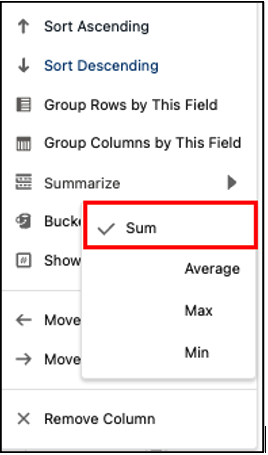
Once we select one of the options, the selected summary option will appear in the Subtotal row. For example, select the Sum Doing so, adds a check mark next to the Sum option.
The values for the chosen summary option also show with respect to the Lead Source grouped row.
- Without the Sum Summary option:
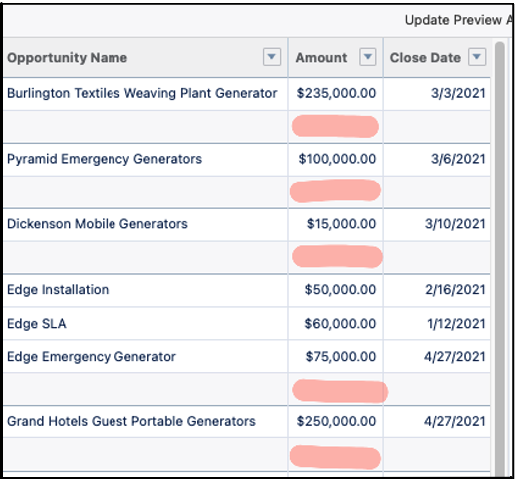
- With the Sum Summary option:
To select multiple Summary options for the report at the same time, check more than one option in the list.
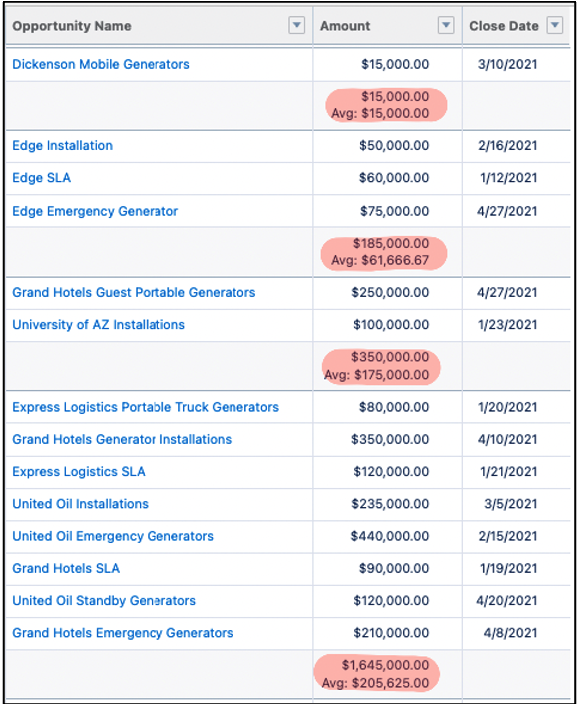
Summary options allow us to answer questions like, “What is the total Amount of all Opportunities with an ‘External Reference’ Lead Source?” or “What is the average Amount of all Opportunities with a ‘Word of Mouth’ Lead Source?”
Back to Creating a Summary Report in Salesforce…
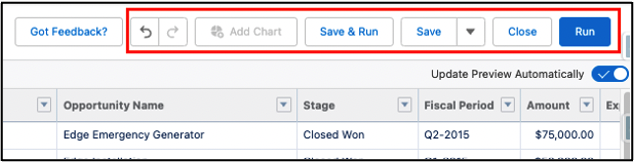
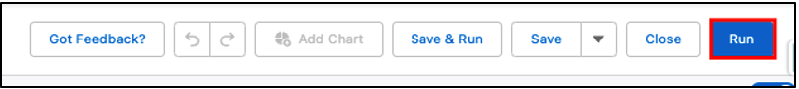
- Finally, click the Run button in the top right corner to run the full report.
- Notice that the summary options we selected also display for the entire report in the report header.
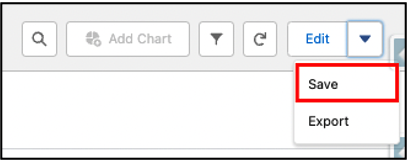
- In the top right-hand corner of the report, click the down arrow to see more report actions. Then click Save.
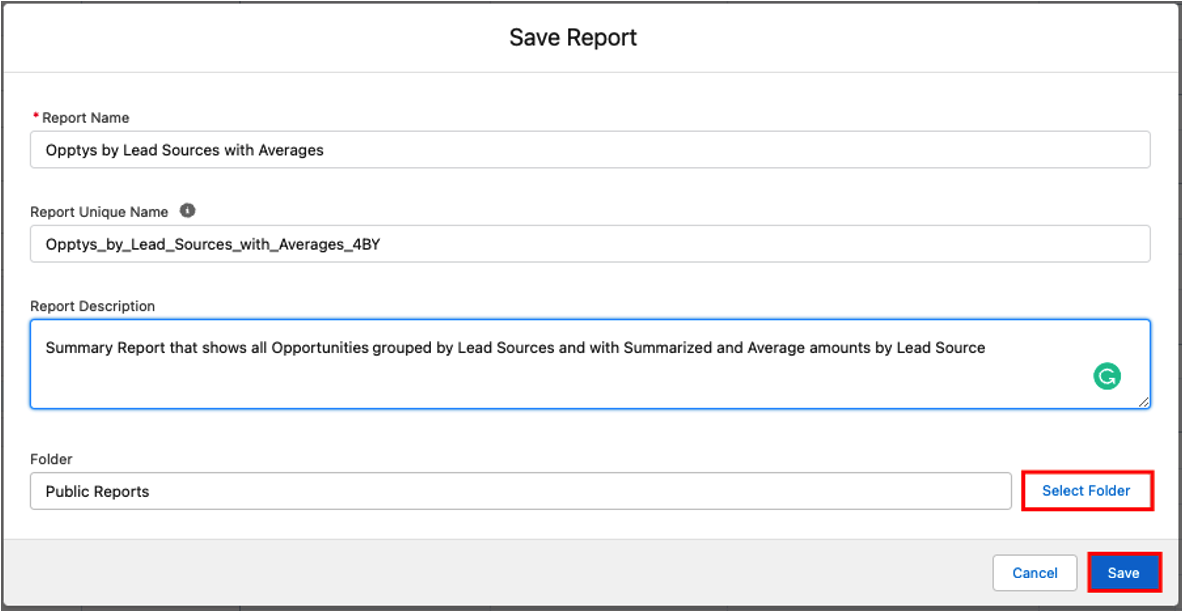
- To save the report, we have to name it and decide where to store it. Enter the below information for the report:
- Report Name: Opptys by Lead Sources with Averages.
- Report Unique Name: Enter a unique name, or tap the Tab button while the cursor is in the Report Name textbox. By clicking the Tab button, Salesforce generates a unique name for you.
- Report Description: Summary Report that shows all Opportunities grouped by Lead Sources and with Summarized and Average amounts by Lead Sources.
- Click Select Folder to select the Public Reports folder to store this report, and then click Save.
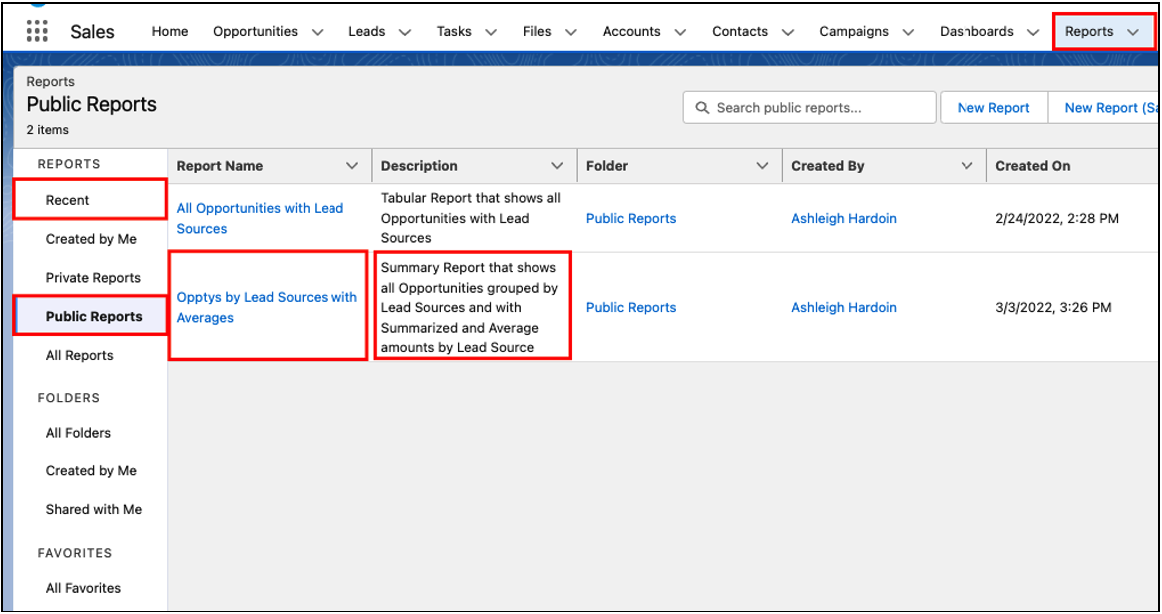
- To go back to our saved report, navigate to the Reports tab again. Select either the default “Recent” reports list or the “Public Reports” list to view the new report. In this view, we can also see the Report Name, Description, and other information.
Salesforce Summary reports are best used for data that needs a simple grouping or summary. They can also be used with dashboards to more easily visualize the grouped and summarized data.
Start at the beginning of the reporting blog series with “Reporting pt. 1: Report Types and Formats.” Or continue learning about Salesforce Reporting in the next post, “Reporting pt. 4: Matrix Reports.”
Additional Report Information:
- Beginning of the reporting blog series: Reporting pt. 1: Report Types and Formats
- Previous reporting blog: Reporting pt. 2: Tabular Reports
- Next reporting blog: Reporting pt. 4: Matrix Reports
- Salesforce Help: Summarize Report Data
- Trailhead by Salesforce: Reports & Dashboards for Lightning Experience Trailhead Module
- Trailhead by Salesforce: Reports & Dashboards for Classic Trailhead Module
- Salesforce Help: Reports
Cover Photo by Priscilla Du Preez on Unsplash