
In previous posts for this reporting series, we learned about Report Types and Formats, as well as two specific types of Report Formats – Tabular reports and Summary reports. Today, we will be creating a Salesforce report with another type of Report Format – a Matrix Report.
What is a Matrix Report?
Like Summary Reports, Matrix Reports are formatted in a way that groups data together for better visibility and analysis. However, Matrix reports group information in both the rows and columns of the report. Whereas, Summary reports just group information by the rows.
Considerations for Matrix Reports
Matrix reports are supported in Dashboards** and can utilize Report Charts**. Additionally, Matrix reports can also include Bucket Fields** and Formulas. However, Cross-Object Formulas are not supported in Matrix reports.
**Bucket Fields, Report Charts, and Dashboards will be covered in later posts. Check out the bottom of this page for related posts!
How to Create a Matrix Report in Salesforce
In the previous report blog post, we created a Summary report to answer the following question: “How many Opportunities exist for each of the Lead Sources?”
Now, let’s take that a step further and answer the following questions with a single Matrix Report:
- What is the count of Opportunities by Lead Source and Type?
- What is the subtotal amount of Opportunities by Lead Source and Type?
Note: To follow along with the steps below, use or create a Playground from Salesforce Trailhead or a Developer Edition org.
(If you are creating your Matrix report by starting from the Summary report from the prior reporting series part 3 post, skip to step 11.)
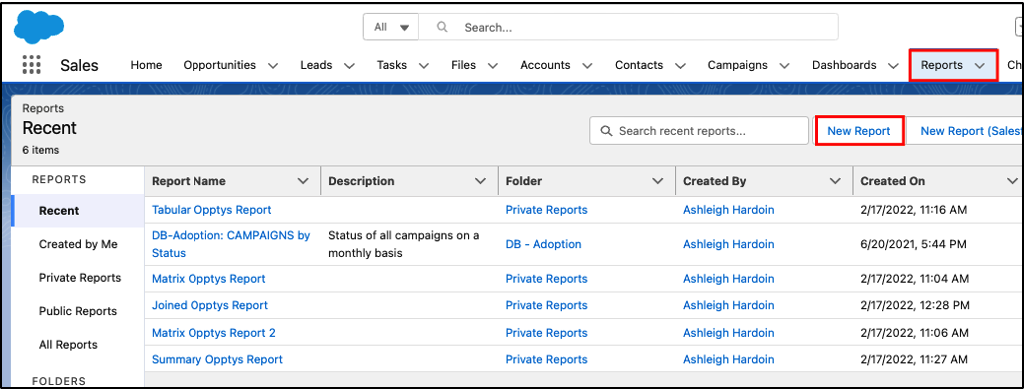
- In Salesforce, navigate to the Reports tab, and click New Report.
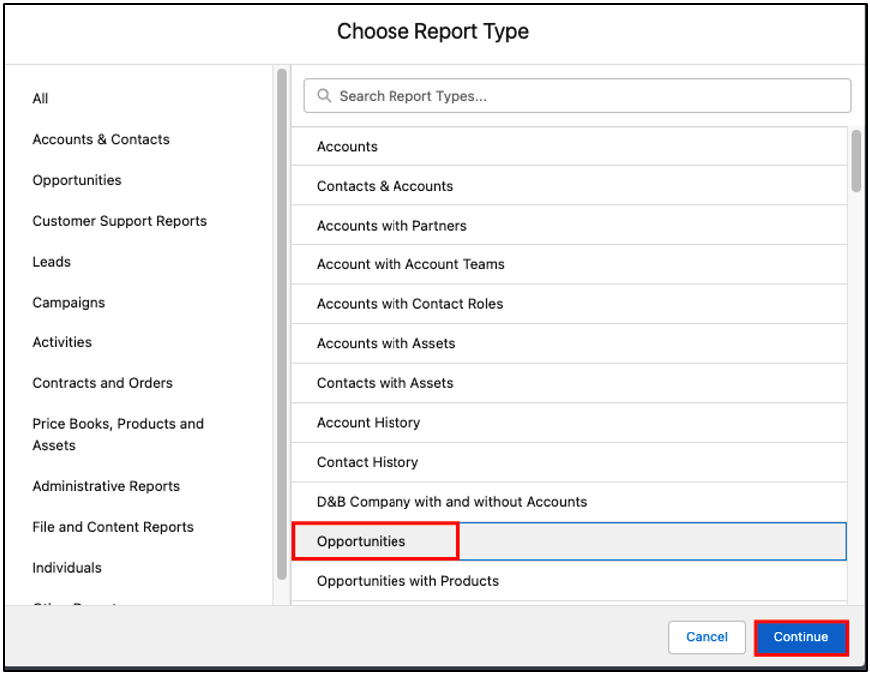
- Select the Opportunities Report Type, and click Continue.
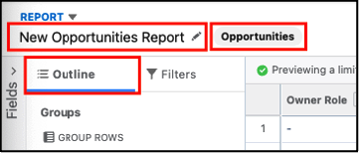
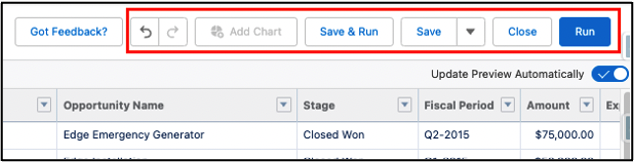
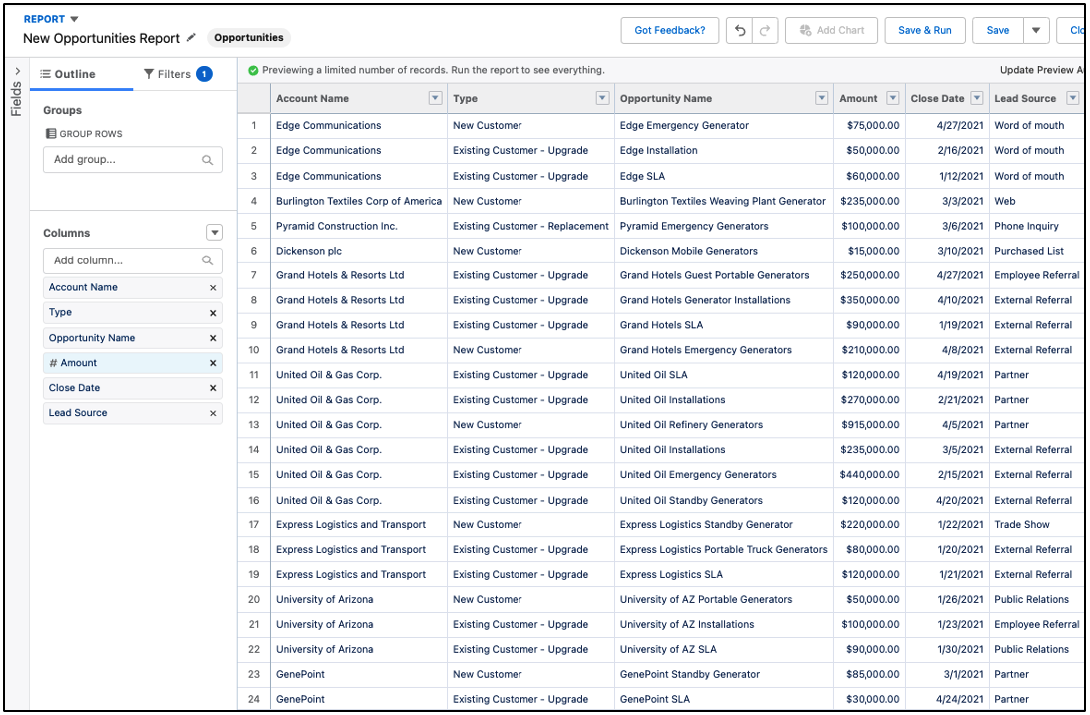
- Notice that when the report generates, the Report Type and Report Name display above the outline. The actions are located at the top right of the report.
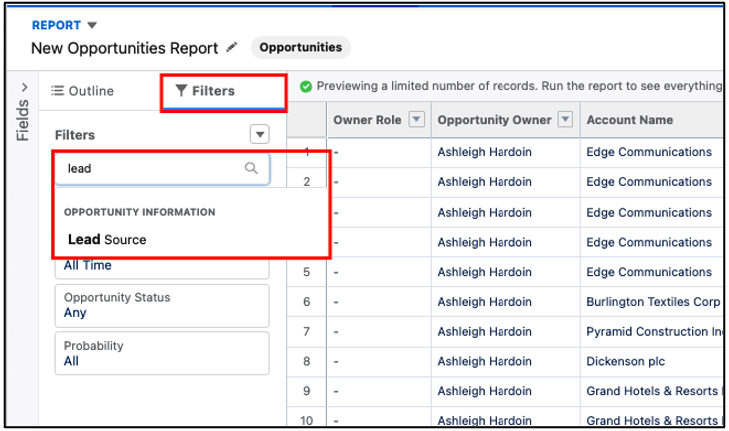
- Let’s update the Close Date to All Time. Next, we are going to add the Lead Source as a Report Filter since we want to see all Opportunities that include a Lead Source. To do this, click on the Report Filters tab. Search for the Lead Source field in the search bar, and select it.
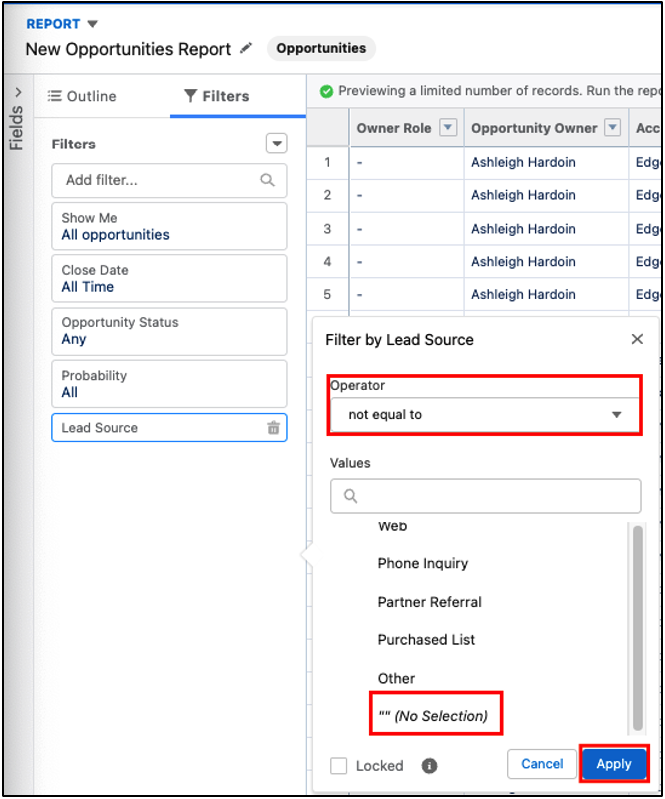
- Filter the Lead Source field so that undocumented values (aka blank values) don’t show by changing the Operator to not equal to and selecting the blank, “” (No Selection) value from the list. Click Apply to save this filter.
- Next, navigate back to the Report Outline to select the data that should be included in our report.
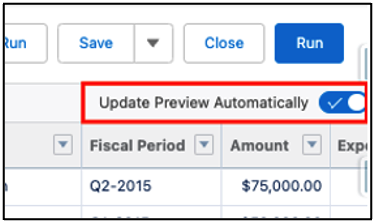
- Toggle the Update Preview Automatically to on. Now, the Columns in the Report Outline match the columns in the report preview. Additionally, the preview updates in real-time when we add or remove columns.
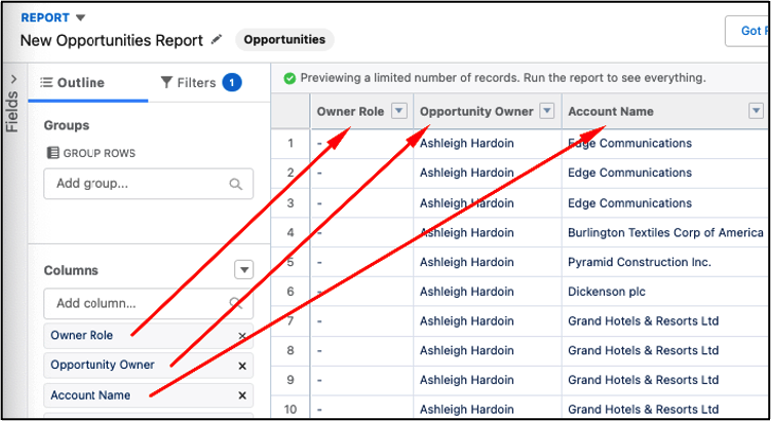
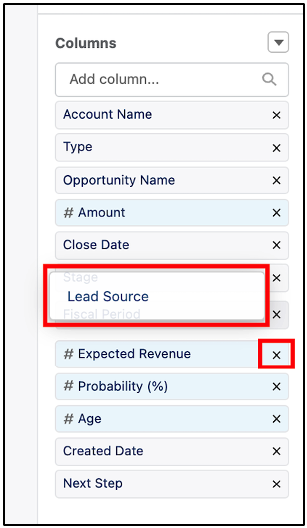
- Drag and drop Columns in the Outline to reorder them, and click the X on the Columns that we want to remove from the report. Update the Columns on this report to the following order and remove the rest: Account Name, Type, Opportunity Name, Amount, Close Date, Lead Source.
Grouping Data in the Report
- In the report preview, we can see that there doesn’t appear to be any order to the records in the report. We will fix this by grouping data on the report.
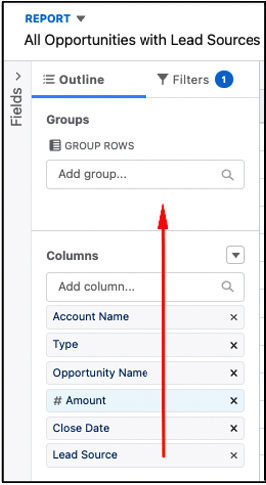
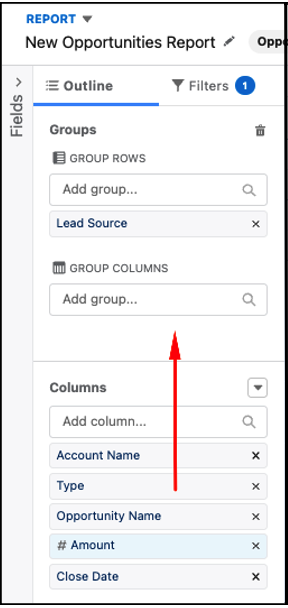
- Drag the Lead Source columns into the Group Rows section for our first set of grouped data. If we leave the report like this, this is a Summary Report, not a Matrix Report.
- Once the report is grouped by rows, another option for grouping information now appears in the report Outline – Group Columns. Additionally, we can see that the count of Opportunities and subtotal amount of Opportunities by both Lead Source and Type are not easily visible in this report format.
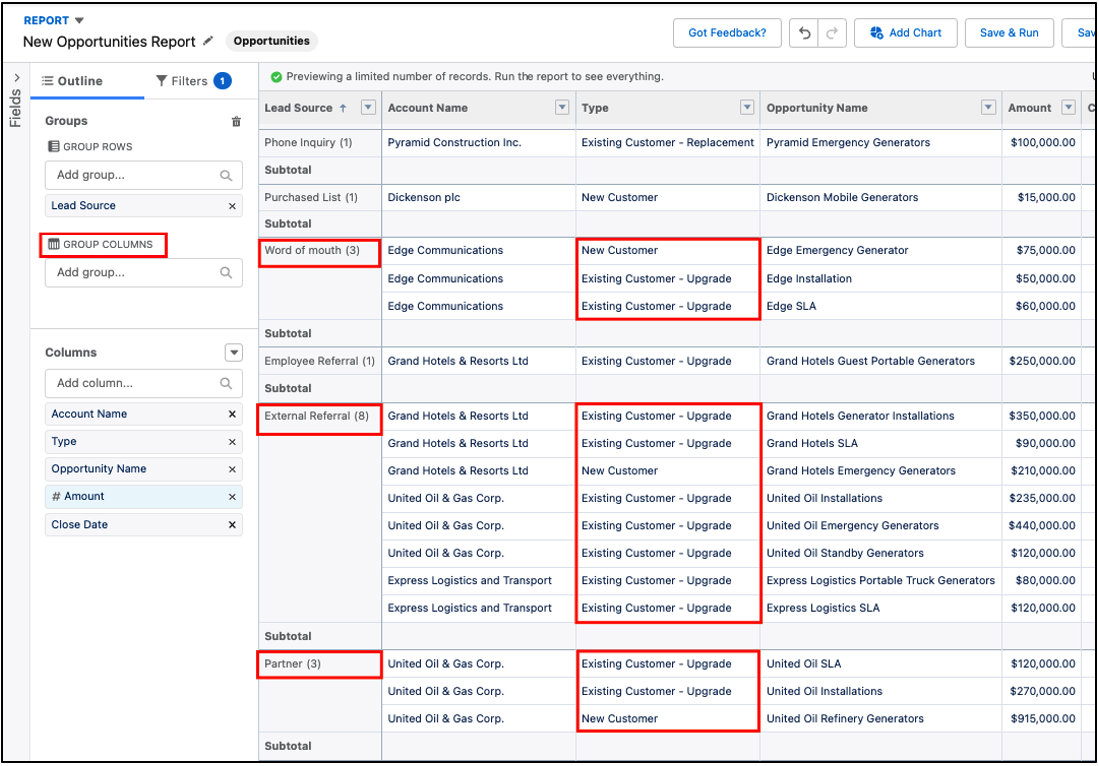
- As a result, we are going to drag and drop the Type column into the Group Columns section. This will further delineate the report data.
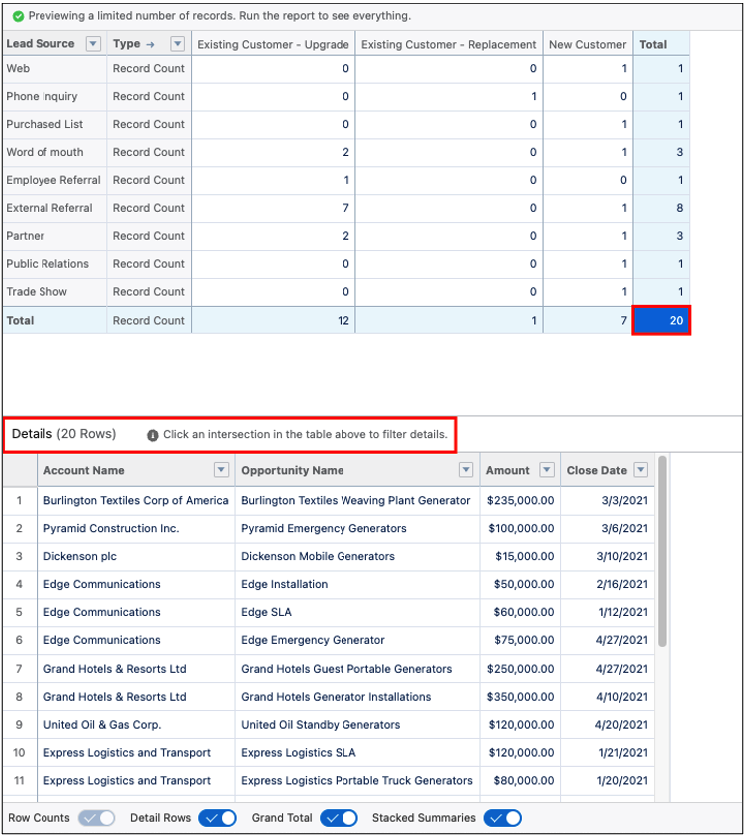
- When we move Type to the Group Columns section, the report splits into two different views. It splits into an overview view and a detailed view. Wherever the cursor has selected data in the top overview, the details for that specific data are displayed in more detail below.
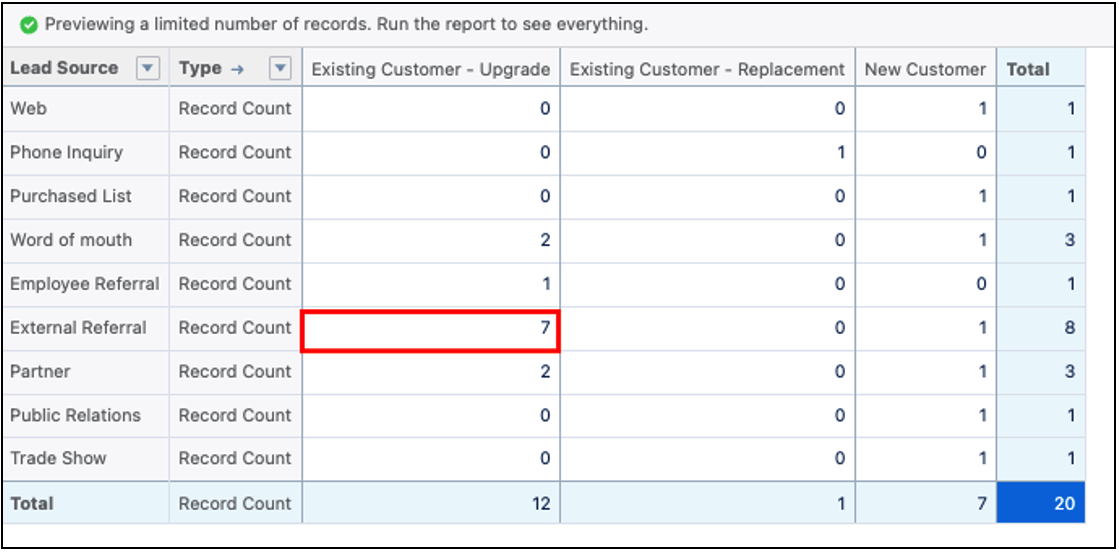
- In the overview section of the report, it’s easy to see the answer to our first question, “What is the count of Opportunities by Lead Source and Type?” For example, we can easily see that there are 7 Opportunities with a Type of “Existing Customer – Upgrade” and a Lead Source of “External Referral.”
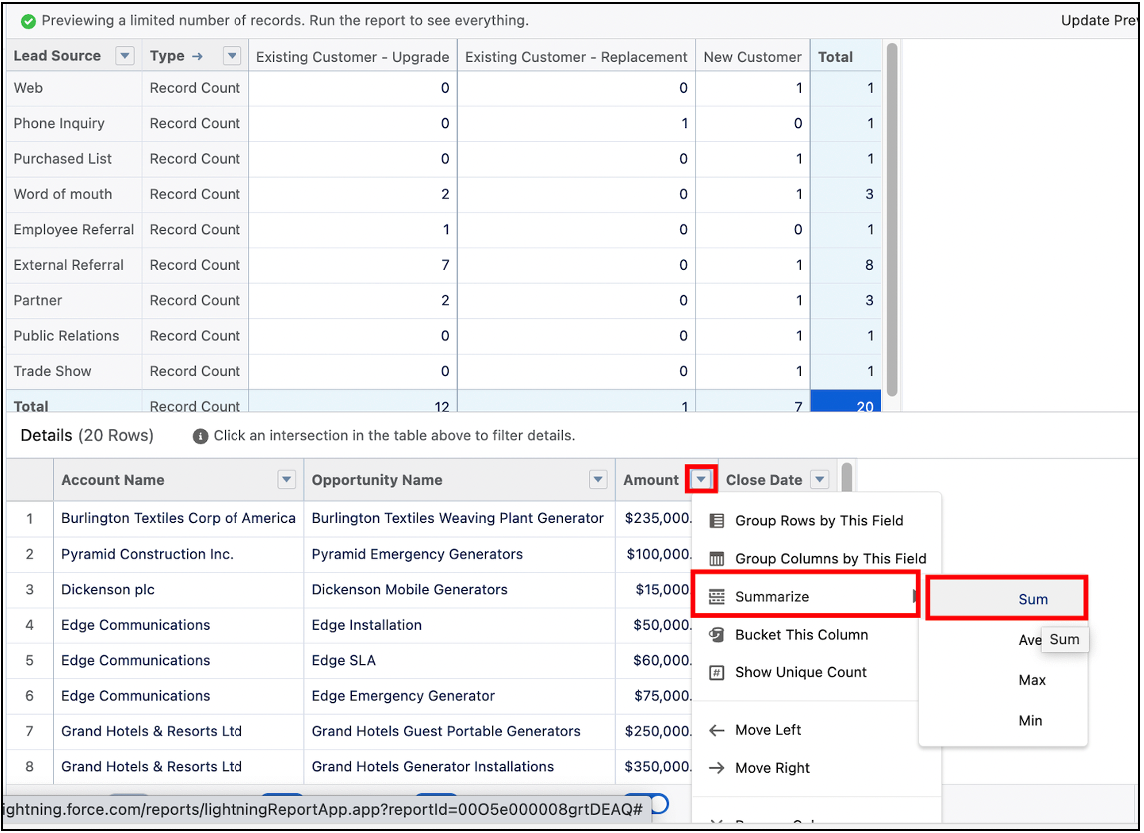
- However, it’s still a little difficult to answer our second question, “What is the subtotal amount of Opportunities by Lead Source and Type?” To answer this question, Summarize the Amount column in the detailed view of the report by Sum.
- Click the down arrow in the Amount column header, mouse over the Summarize option, and then select Sum.
 Now we can see the subtotal amount for each Lead Source/Type combination in the overview of the report.
 - Consequently, we don’t need the detailed view of the report to answer our questions, so we can toggle off the “Detail Rows” option at the bottom of the report. Our updated report preview will now only display the overview view.

Save the Report
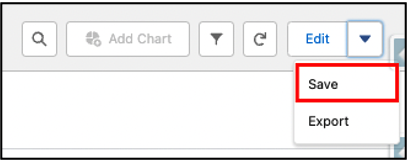
- If we like the way this report looks, in the top right-hand corner of the report, we can click the down arrow to see more report actions and click Save.
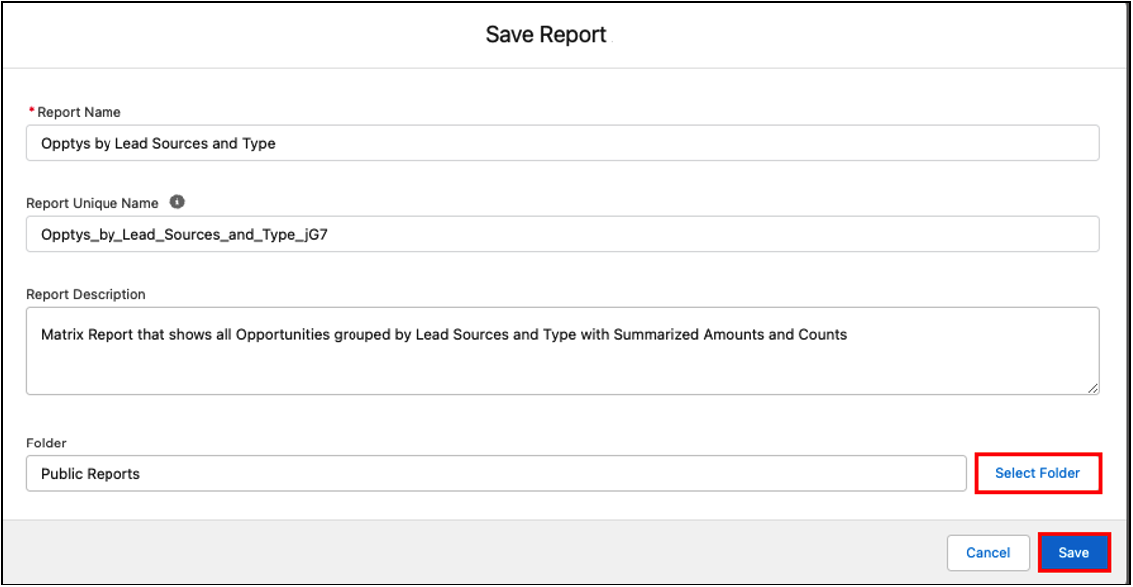
- To save the report, we have to name it and decide where to store it. We’ll enter the below information for the report:
- Report Name: Opptys by Lead Sources and Type
- Report Unique Name: Either enter a unique name or tap the Tab button on your keyboard while the cursor is in the Report Name textbox to have Salesforce generate a unique name for you
- Report Description: Matrix Report that shows all Opportunities grouped by Lead Sources and Type with Summarized Amounts and Counts
- Click Select Folder to select the Public Reports folder to store this report, and then click Save.
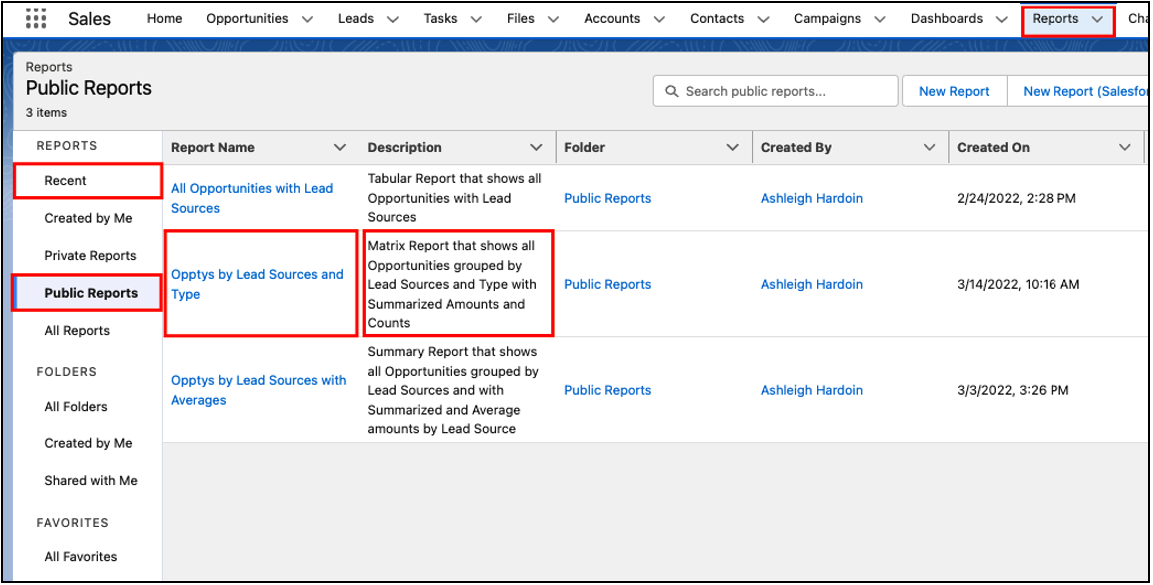
- To go back to our saved report, navigate to the Reports tab again. The report can be viewed in either the default “Recent” reports list or by clicking on the “Public Reports” list.
Matrix reports are best used for data that needs to be grouped or categorized in more than one way. Depending on the desired report information, dashboards are also a useful tool to display matrix report results.
Start at the beginning of the blog post series with “Reporting pt. 1: Report Types and Formats.” Or continue learning about Salesforce Reporting in the next post, “Reporting pt. 5: Joined Reports.”
Additional Report Information:
- Beginning of the reporting blog series: Reporting pt. 1: Report Types and Formats
- Previous reporting blog: Reporting pt. 3: Summary Reports
- Next reporting blog: Reporting pt. 5: Joined Reports
- Trailhead by Salesforce: Reports & Dashboards for Lightning Experience Trailhead Module
- Trailhead by Salesforce: Reports & Dashboards for Classic Trailhead Module
- Salesforce Help: Reports
Cover Photo by Compare Fibre on Unsplash