
In previous posts for this reporting series, we briefly mentioned Report Charts and how not all report formats in Salesforce can utilize Report Charts. Reports with a Tabular format cannot have charts added to them. However, reports with a Summary, Matrix, or Joined format can have charts added to them.
Today, we will be learning how to add a Chart to a Report.
What is a Report Chart?
A Report Chart is a visual representation of data in a report. People can quickly discern patterns and deviations from patterns when viewing data in a visual format. As a result, charts allow users to understand data much faster than if the user was just reviewing a table of information. Consequently, charts can help users quickly and efficiently spot errors in the report data, spot errors with the way a report has been constructed, and easily spot unusual data points.
For instance, say we had a Report Chart that displays Opportunities with a Billing Address in the United States. The report also shows that the average Opportunity Amount for those Opportunities is about $100,000. Then, we see an Opportunity with an Opportunity Amount of $1,000,000. Immediately, that Opportunity draws our attention because it’s so different than the rest of the Opportunities. As a result, we know we need to look at the unusual Opportunity a little closer to determine if:
- It’s an outlier because of a data error, such as a typo in the Opportunity Amount, or
- It’s an outlier because it’s truly a higher-value Opportunity, and we should make sure to prioritize and keep this Opportunity at the forefront of our future business discussions.
Considerations for Charts
The appearance of Report Charts can be impacted by a number of factors. Those factors can include: outliers in the data, custom summary formulas, data permissions like field-level security, report formats, grouping and buckets, and negative values. There are guides to how changing a report format changes the report itself and the associated Report Chart, such as the “Present Data Effectively with Charts” Salesforce Help article. However, I have found that actively testing out different ways to view data both on the report and the Report Chart has helped me gain reporting knowledge the fastest.
Don’t be afraid to change your reports regularly, especially if you find that the current presentation of information isn’t working for you or your users!
How to Add a Chart to a Report
To create a Report Chart, we first need to start with a Report Format that supports charts. Summary, Matrix and Joined Report Formats all support Report Charts. Only the Tabular format does not support Report Charts.
For this example, I’m going to start with the Summary report that we created in part 3 of this reporting series. For this Report Chart, we’d like to create a chart to display:
- The average Opportunity Amount by Lead Source
- A reference of $150,000 as the goal average Opportunity Amount for each Lead Source
Note: To follow along with the steps below, use or create a Playground from Salesforce Trailhead or a Developer Edition org.
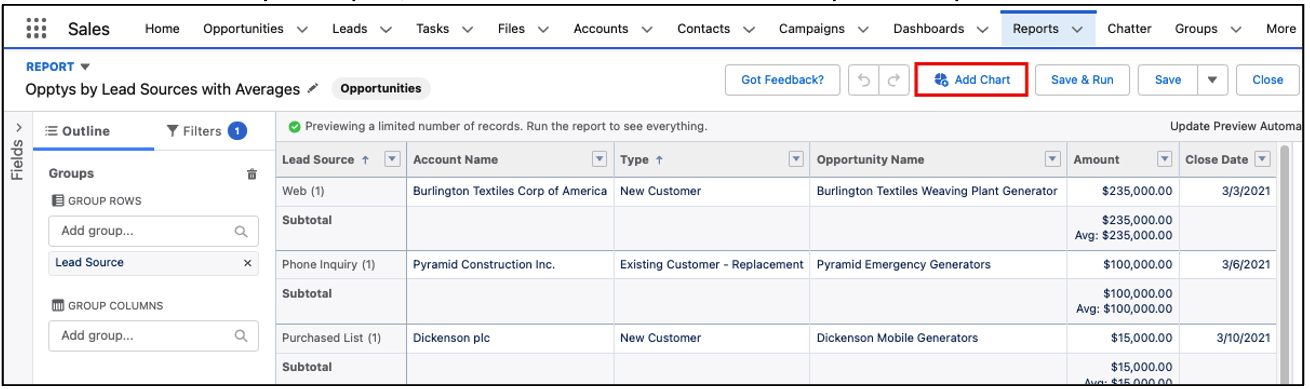
- Once in Edit mode on your Report, click the Add Chart button at the top of the report.
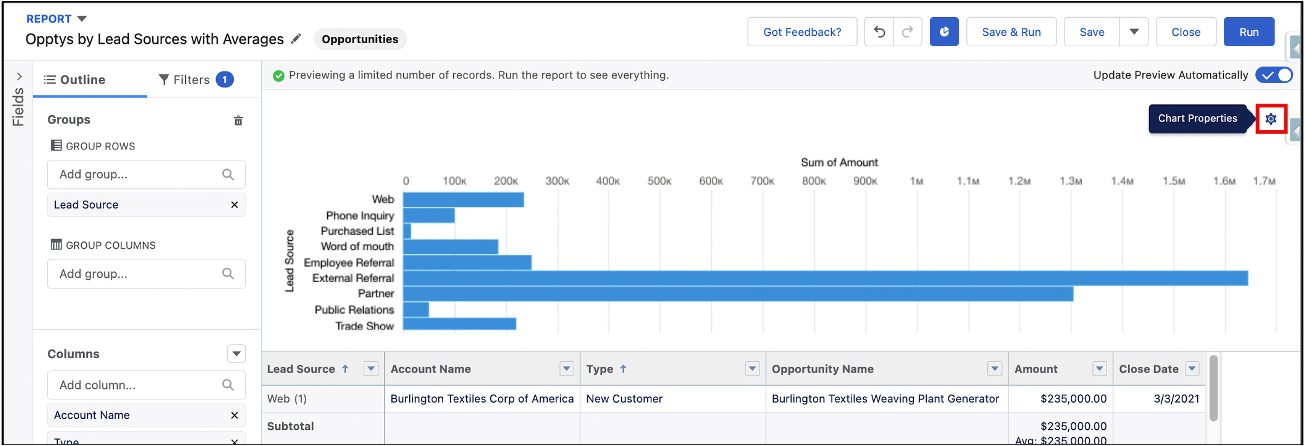
- Salesforce automatically defaults the Report Chart to a suggested chart. But we can update the chart by clicking the Chart Properties wheel.
- From the Chart Properties, we can choose a different Chart Type, as well as add and change additional Chart Attributes. Initially, Salesforce defaulted our Report Chart to a horizontal Bar Chart – let’s change it to Column Bar Chart
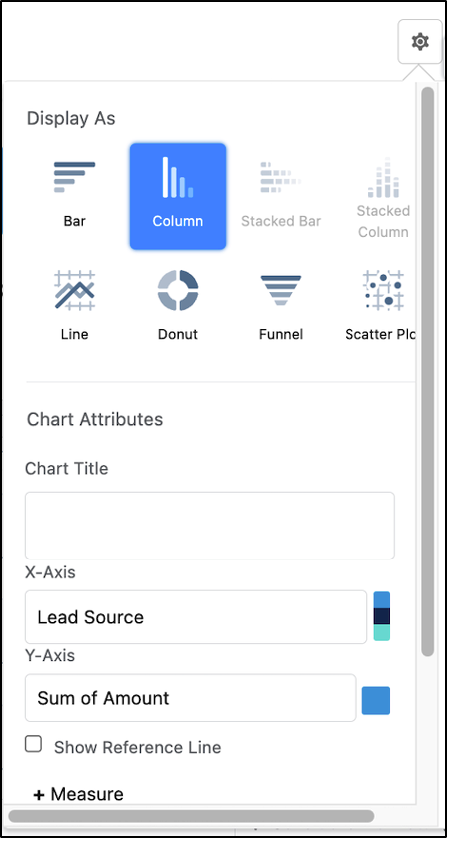
- We’ll also:
- Add a Chart Title: Oppty Amount by Lead Source
- Confirm the X-Axis is Lead Source
- Update the Y-Axis to Average Amount
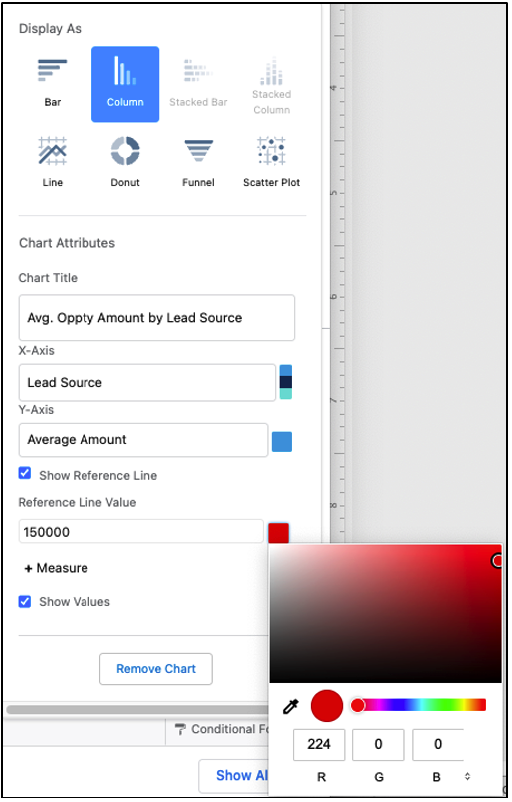
- Check the Show Reference Line box
- Enter 150,000 as the Reference Line Value
- Click the blue box next to the Reference Line Value, and change the color to red
- Check the Show Values checkbox
- Click the Chart Properties wheel again to hide the properties.
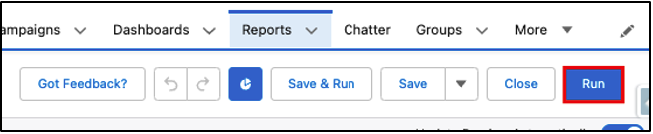
- Click Run in the top right corner to view our Report Chart on our Summary Report.
Reviewing the Report Chart and Data
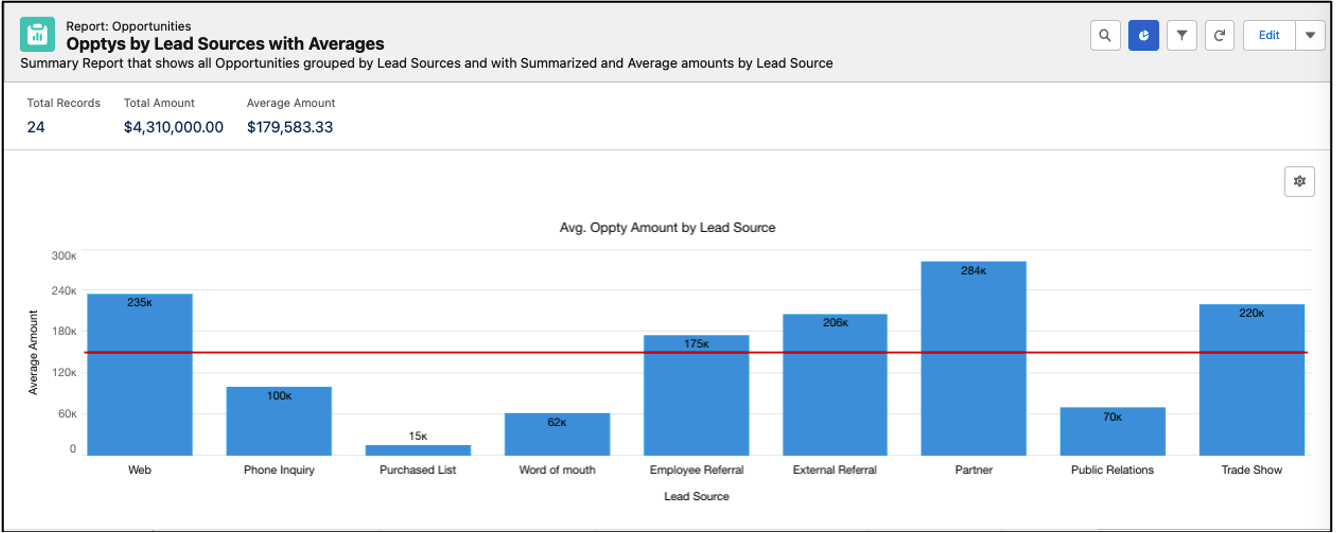
- When the Summary Report loads, we can see that the Report Chart displays the information we just entered: the Title, Lead Source, Average Opportunity Amount, and the Reference Line, and it all corresponds to the report data. Taking a closer look at a specific data point, we can see that the average Opportunity Amount for the Employee Referral Lead Source is $175,000 in the Report Chart and the report data.

- Additionally, we can also see the Reference Line Value of $150,000 falls below the Employee Referral column in the chart since the reference value is less than the average Opportunity Amount for the Employee Referral Lead Source.
- If we like the way this report chart looks, in the top righthand corner of the report, we can click the down arrow to see more report actions and click Save.
Report Charts are a quick, and extremely useful tool to include in reports. They help users visually understand the data in the report much faster than if they just had to view the information in a strictly report format.
Additional Report Information:
- Beginning of the reporting blog series: Reporting pt. 1: Report Types and Formats
- Previous reporting blog: Reporting pt. 6: Bucket Fields
- Next reporting blog: Reporting pt. 8: Report Chart Types
- Trailhead by Salesforce: Reports & Dashboards for Lightning Experience
- Trailhead by Salesforce: Reports & Dashboards for Classic
- Salesforce Help: Reports
Cover Photo by Markus Winkler on Unsplash