
In the previous post for this reporting series, we learned how to add a chart to a report. Today, we’ll be learning about some of the different Salesforce Report Chart Types.
Viewing the Available Chart Types
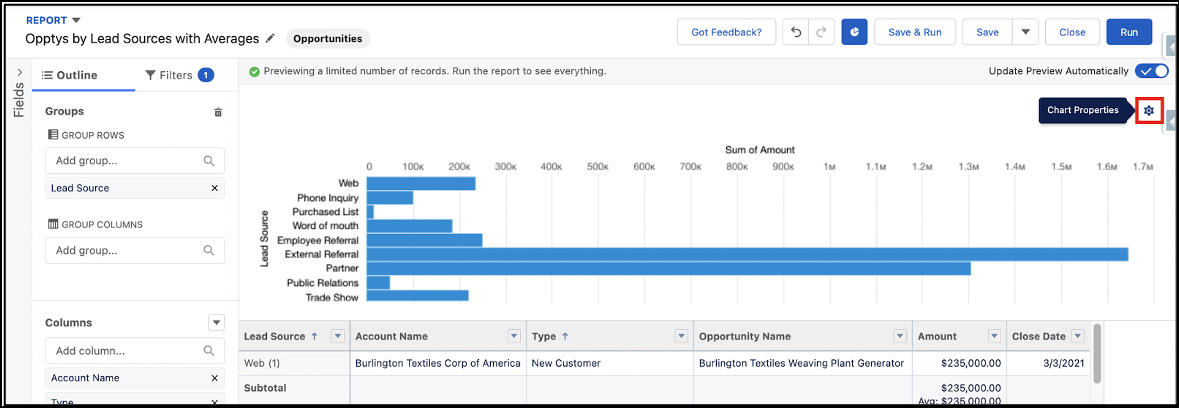
When we click the “Add a Chart” button on a report, Salesforce adds a suggested chart type based on the available data – usually the horizontal Bar Chart.
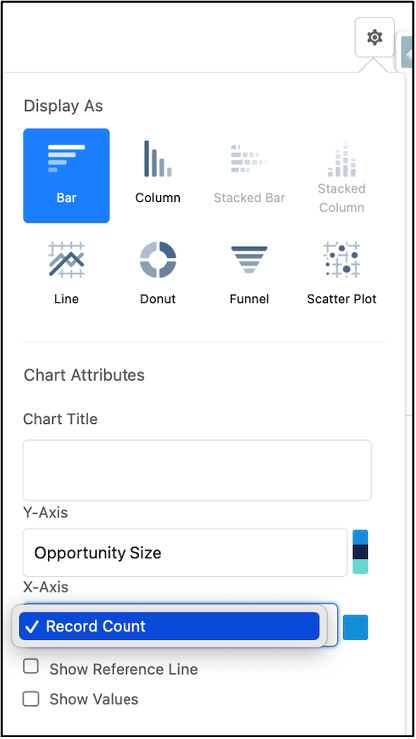
By clicking on the Chart Properties wheel, we can view the other available Chart Types.
The currently selected Chart Type will have a blue background color like the Bar Chart selection in the below picture. Other chart types compatible with the data in the report will have a white background color like the Column, Line, Donut, Funnel, and Scatter Plot selections in the below picture, while the incompatible chart types will be semi-transparent like the Stacked Bar and Stacked Column selections in the below picture.
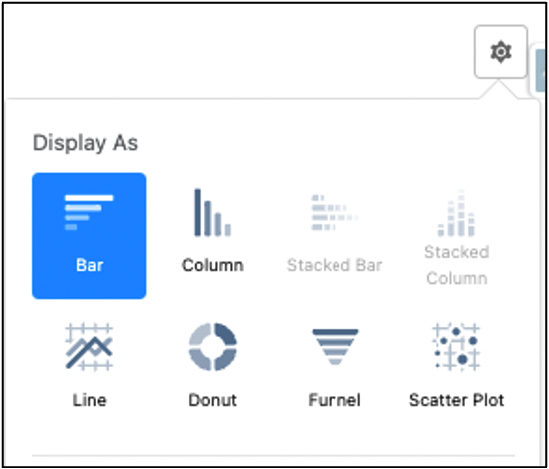
Salesforce includes a small picture of what each chart type looks like with the chart type name so users can easily identify the charts before selecting a type.
Along with descriptions of the chart types below, I’ve included examples of the types using modified versions of the ‘Open Opptys by Size’ report that was created in the 6th post of this Reporting Series.
What are the Chart Types?
There are 8 Chart Types available in Salesforce Lightning. These Chart Types are:
- Bar Charts
- Column Charts
- Line Charts
- Donuts Charts
- Funnel Charts
- Scatter Charts
- Stacked Bar Charts
- Stacked Column Charts
Let’s review the first 4 of these chart types below.
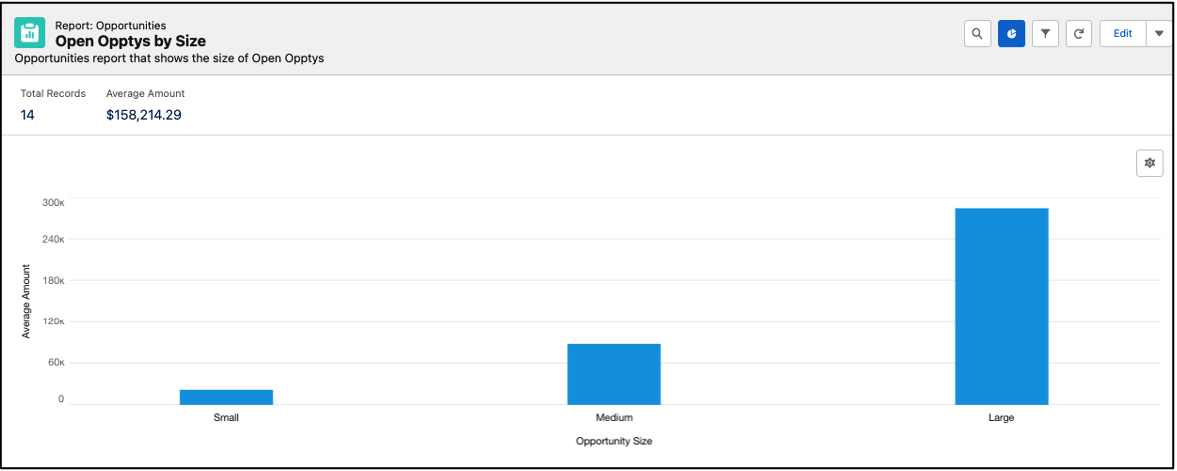
1. Bar Charts
Bar Charts display values on the horizontal, x-axis. This chart type is best for reports with a single grouping on a Summary report. It’s also preferred when you only want to display a single grouping of information for a different report format. This chart type is recommended to compare distance or time.
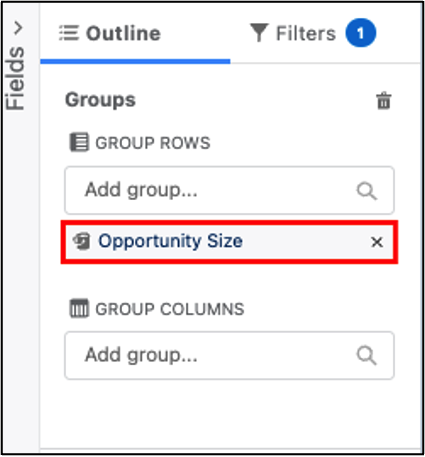
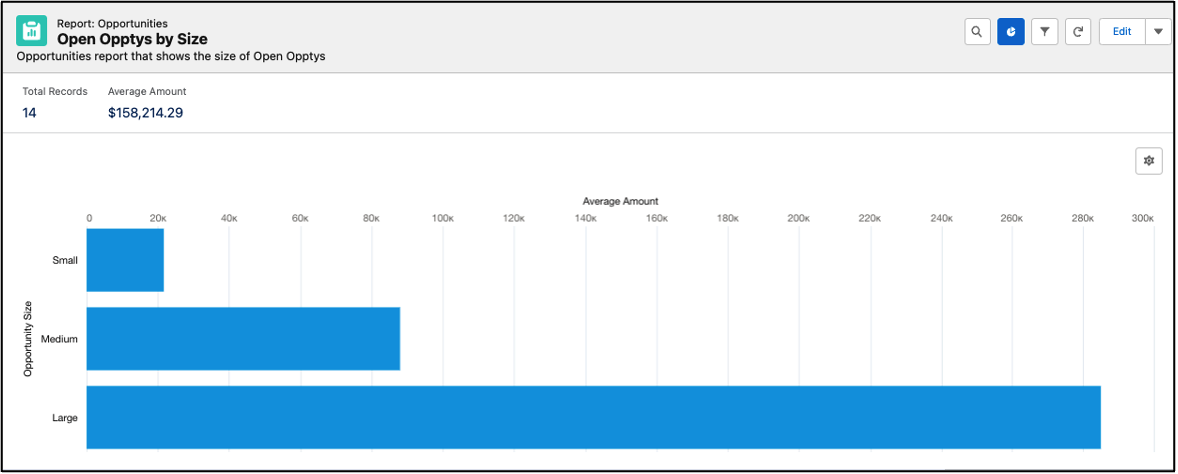
In the pictured example, the Bar Chart for the ‘Open Opptys by Size’ report has a single grouping. The Opportunity Size is selected as the Group Row for the report.
As a result, the Bar Chart displays the Opportunity Size and the Record Count per Opportunity Size bucket.
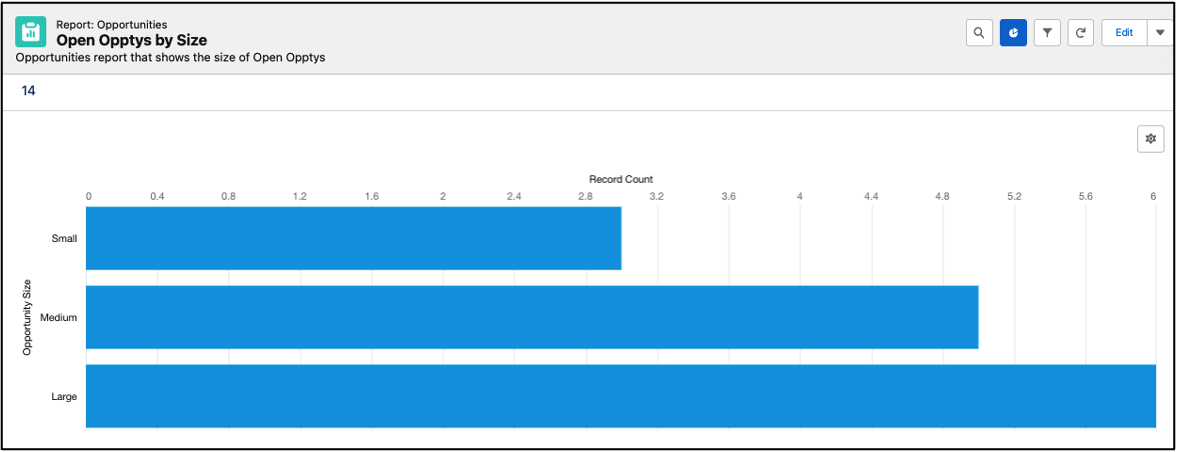
Without summarized values on the underlying report, the only available option for the x-axis value is Record Count.
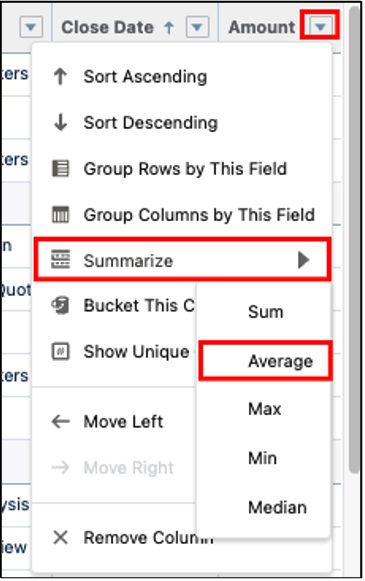
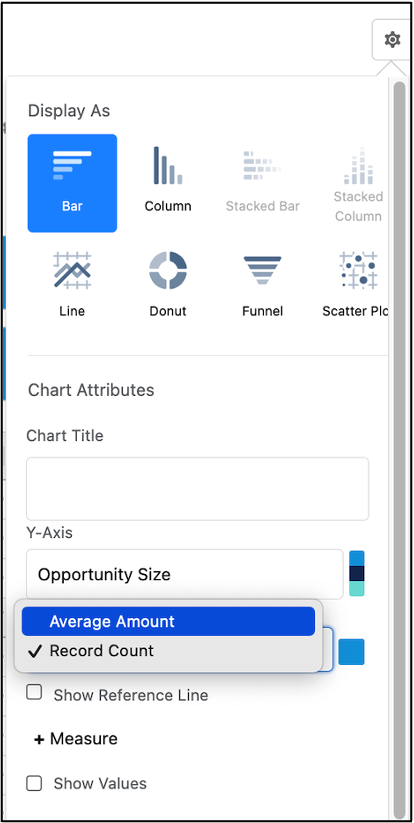
However, if we summarize a value on the underlying report, such as the Amount column by Average, we can replace the Record Count on the chart with the Average Amount summary we just created.
Now the Bar Chart shows the Average Opportunity Amount by Opportunity Size.
2. Column Charts
Column Charts display values on the vertical, y-axis. This chart type is best for reports with a single grouping on a Summary report. It’s also preferred for displaying a single grouping of information for a different report format. This chart type is recommended to show counts of data.
Using the same values as the example above, we can change the chart type to a Column Chart.
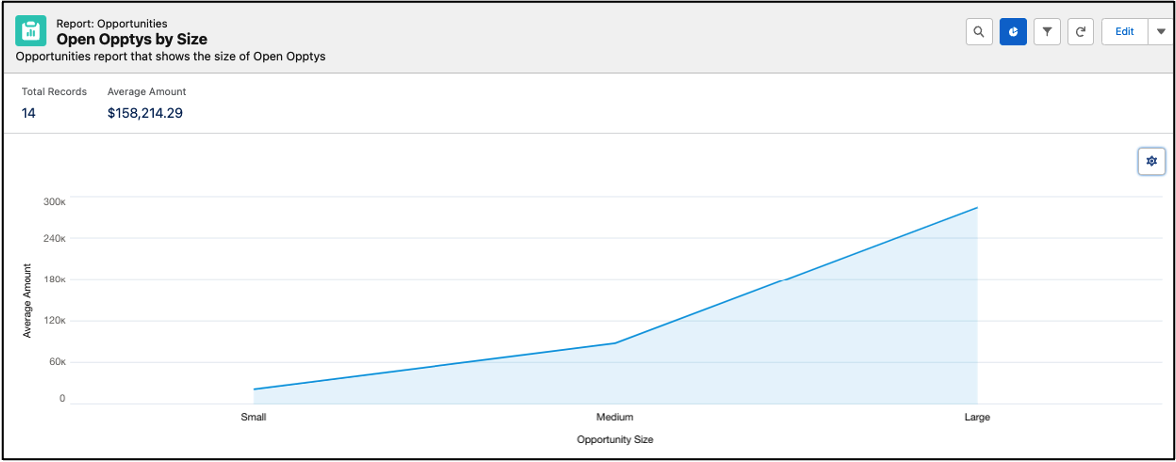
3. Line Charts
Line Charts display values as a series of points over time, such as month to month or quarter to quarter. This chart type is best for showing one value and an ordered set of data.
Using the same values as the example above, we can change the chart type to a Line Chart.
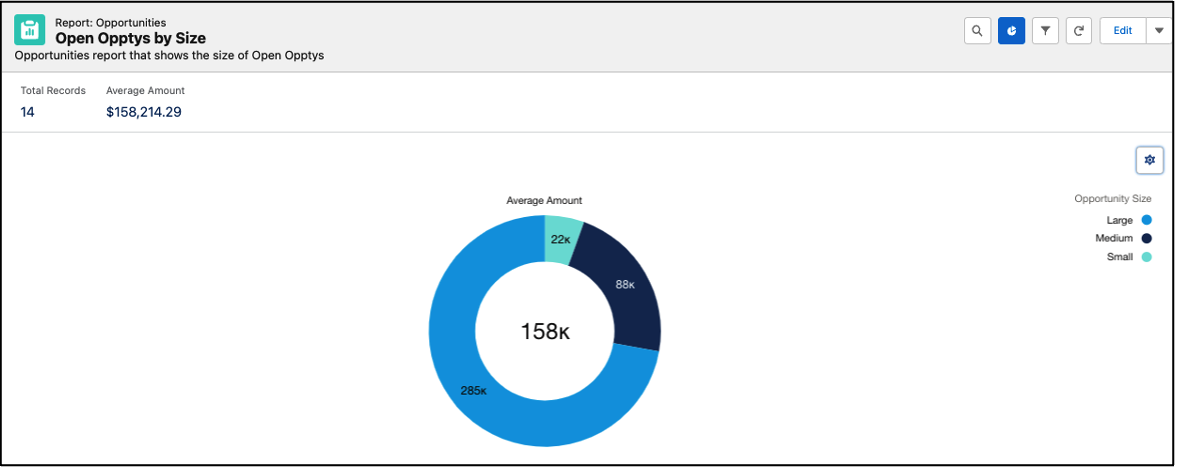
4. Donut Charts
Donut Charts are similar to Pie Charts and also display multiple groupings and the proportion of a single value for each grouping against the total. But Donut Charts also show the total amount itself.
Using the same values as the example above, we can change the chart type to a Donut Chart.
Continue learning about the rest of the Report Chart Types in the next blog post, “Reporting pt. 9: Report Chart Types Continued” (coming soon!)
Additional Information:
- Beginning of the reporting blog series: Reporting pt. 1: Report Types and Formats
- Previous reporting blog: Reporting pt. 7: Add a Chart to a Report
- Next reporting blog: Reporting pt. 9: Report Chart Types Continued
- Salesforce Help: Reports
- Salesforce Help: Chart Types
Cover Photo by Алекс Арцибашев on Unsplash