
Dashboards in Boomi:
The dashboard is a screen that shows all the stats related to the API such as Execution status, Summary of the executions, Average response time, etc.
There are 3 types of dashboards available in Boomi. Those are:
- Account Dashboard
- HTTP Dashboard
- Real-Time Dashboard
Boomi provides the account dashboard to all accounts irrespective of the services enabled whereas in order to access HTTP Dashboard and Real-Time Dashboard you must need to enable the services enablement feature in your account.
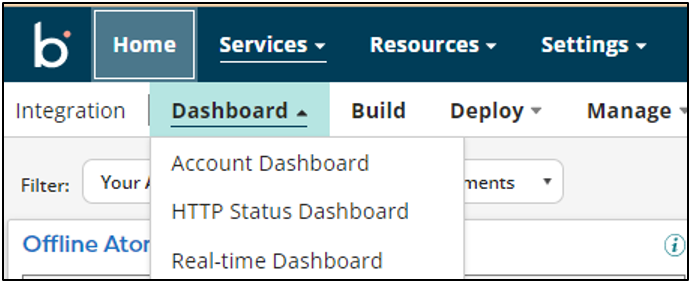
To access dashboards, you have to navigate to Services->Dashboard->Choose the required dashboard that you want to see here.
Let’s see about each dashboard in detail now below:
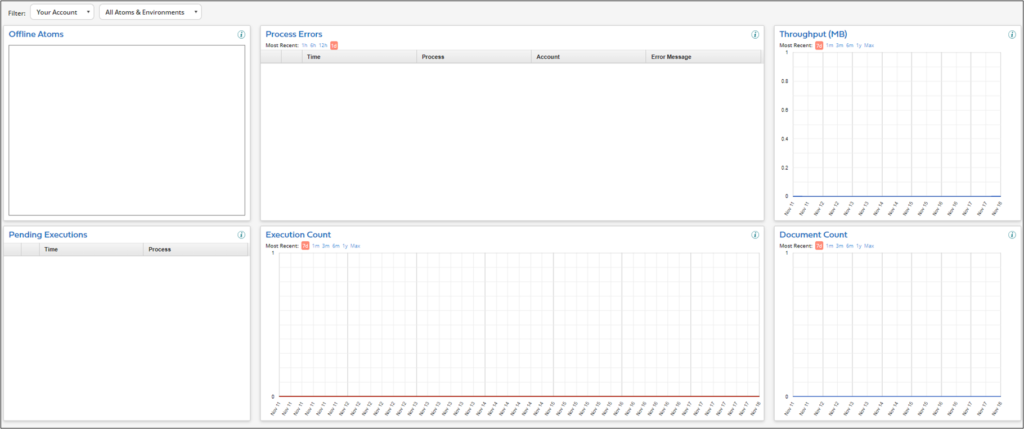
Account Dashboard:
Account Dashboard shows us the list of all offline atoms in the account, Process Errors, Throughput (GB/MB), pending executions, executions count (in thousands), and Documents count with a filter varying from min past 7 days to max past 1 year.
You can see all of the above data on the account level which means combined stats of all environments or you can choose a particular environment and see the stats.
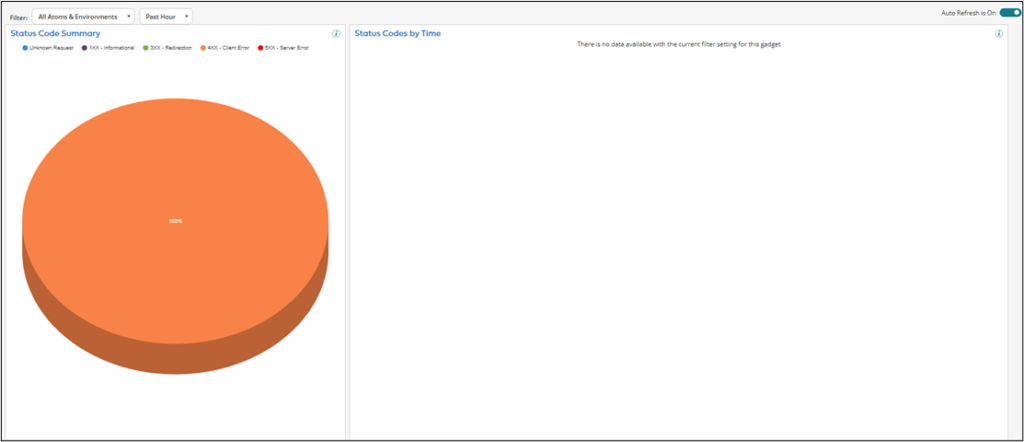
HTTP Status Dashboard:
This dashboard shows us the details of below two stats:
- Status Code Summary: This shows us the Summary of all status codes which are not in the success range (200-299) series.
- Status Codes by Time: This displays the number of status codes over a period of time.
The status codes which are other than the success range (200-299) series are below:
- 1xx means Informational
- 3xx means redirection
- 4xx means client error
- 5xx means server Error
Real-time Dashboard:
With the filters on atoms/Environments, Processes, and over a period of time it shows the details of below things:
- Execution status by time: This displays the number of executions of each status type over a period of time.
- Execution status: This displays the number of executions of each status type.
- Average Response Time: This displays the average response time by the time of the request.
- Process Summary Report: This displays the processes executed along with the execution details. Click on a process to see the details broken down by status.
Cover Photo by Luke Chesser on Unsplash